

Whilst we may all be tired of hearing about COVID-19 and its impact on just about everything to do with our everyday lives, it is important for those involved with cash and payments to examine its impact on cash and payments to date and perhaps, more importantly still, the implications for the future.
Two recent publications approach this from different angles. One examines the data from a single country, Canada, based on research by the Bank of Canada. The other uses data from four countries, the UK, the US, Spain and Mexico, as well as the EU. The first is covered here. The second will feature in next month's issue.
The first part of this paper is based on data from the Bank Note Distribution System (BNDS) to track how the amount of cash in circulation changed throughout 2020.
The value of notes in circulation (NIC) increased significantly in the early months of the pandemic, slowing in July. Of note is the characteristic year-end spike consistent with traditional seasonal trends.
The value of NIC at the end of 2020, C$100.4 billion, was 16% higher, +C$ 13.8 billion, than that of the previous year. Based on a projection from early March 2020, had COVID not occurred, the expected increase would have been around C$4.9 billion, suggesting the pandemic added around C$8.9 billion (Chart 1).
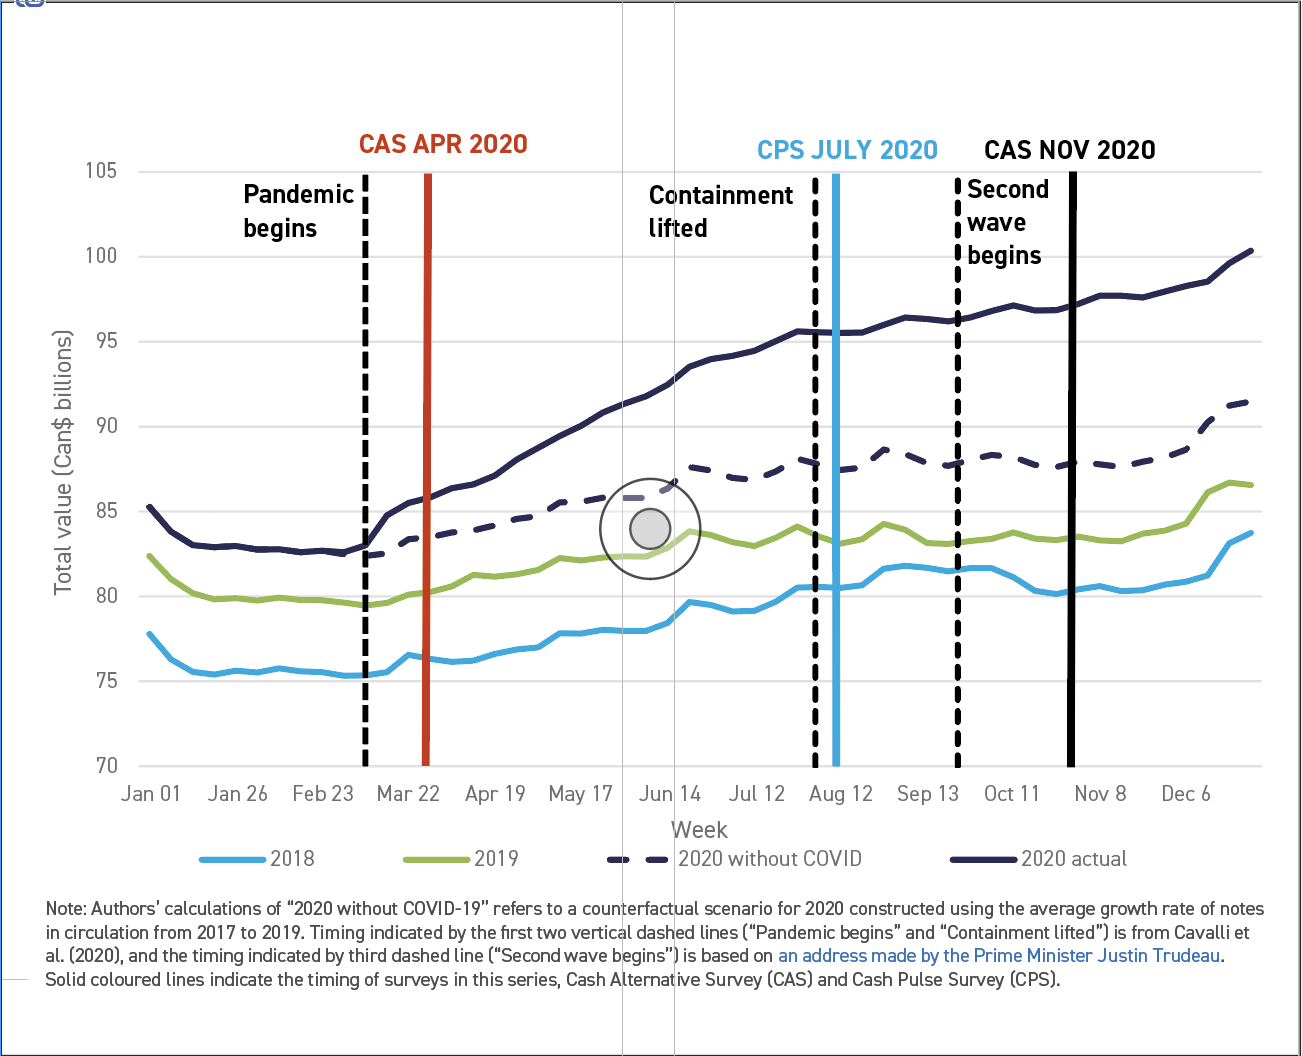 Chart 1: Bank notes in circulation, by year.
 To determine whether there was any significant difference in the demand for high value notes (C$50 and C$100) compared with low value notes (C$20, C$10 and C$5), the change in NIC value (the value of net note withdrawals of banknotes less deposits made to the bank) for the two groups was compared against calculations of what would have been expected had the pandemic not occurred.
The result indicated that the increased demand for banknotes from March 2020 was greater for large denomination notes, suggesting store of value motives were important. It was also noted that demand for smaller value notes was weaker than expected, suggesting less demand for transactional notes.
The excess demand for both high and low denomination groups was high in the early months of the pandemic but by July demand had returned to more normal levels, consistent with lockdown provisions reducing the increased opportunities for in-person shopping where cash could be used. Also, low deposits of notes to the Bank early in the pandemic could also have been related to a reduced capacity of participants in the cash cycle to handle or transport notes.
As restrictions were relaxed and opportunities to shop in person increased through the summer of 2020, merchants may have accumulated cash. But, with a second wave of COVID-19 appearing in the autumn, some of the same pressures that discouraged the use and circulation of cash from May to July may have recurred, reducing the flow of deposits to the Bank.
Also, later in the year Canadians increased their own cash holdings in line with seasonal patterns. The pandemic had actually doubled the increase in the value of the NIC that could be expected in 2020. The substantial stock of banknotes that had accrued in the economy could either return to the Bank over time as conditions normalised, or the NIC value could remain unusually high.
The second part of the paper used consumer surveys conducted in April, July and November 2020 to study how COVID-19 affected the demand for cash and the use of various methods of payment. The April 2020 and November 2020 surveys were Cash Alternative Surveys (CAS), the July survey when most restrictions had been lifted was a Cash Pulse Survey (CPS). The November 2020 survey, coinciding with the second wave of the pandemic when some restrictions reappeared, included a three-day payment diary which was compared with similar diaries from 2009, 2013 and 2017 to study long-term trends in cash use and payment methods.
The use of all payment methods was stable or increasing in November compared with July 2020, with cash use showing the largest increase (59% in November compared with 54% in July), confirming the trend of growing cash use after the initial lockdown measures and despite the beginning of the second wave of the pandemic.
Canadians who hold cash held a median of C$80 in November CAS up from C$70 in July CPS and C$85 in April 2020 CAS. They also held C$270 in other cash holdings (OCH), ie. not in the respondent’s purse, wallet or pocket so at home, in the car etc.
OCH are motivated by store-of-value or precautionary factors, while cash on hand is most likely for transactions. It was noted that OCH are unevenly distributed across the population, with many people holding no or minimal cash reserves but others, smaller in number, keeping very large sums. The mean (non-zero) OCH was C$720 and the median (50th percentile) C$270 in November, which means that half the population hold more and half less than C$270.
The survey also indicated that 70% of respondents hold less than c. C$500 and 10% hold more than C$2,000. People held more OCH when the severity of the pandemic was high in April CAS 2020 and November CAS 2020.
A large majority (80%) of Canadians reported in the November 2020 CAS that they have no plans to go cashless in the next five years, compared with 78% in the July 2020 CPS.
The number and value of transactions paid with cash declined steadily between November 2017 and November 2020. At the same time, shares of contactless payments increased significantly. But a significant portion of low value transactions was still made with cash in November – 40% of transactions below C$15 were cash.
Cash use tends to be more prevalent in certain demographic groups – older, less educated and low-income individuals. All demographic groups paid for at least 25% of their purchases with cash.
The proportion of Canadians who report holding zero cash on hand increased slightly from 20% in July to 22% in November.
Although over 20% of the volume of purchases were made in cash in the November 2020 study, it also showed that the cash share has been steadily declining in recent years, from 44% of purchases in 2013 to 33% in 2017 and then 20% in 2020.
On the other hand, the share of credit card purchases increased from 39% in 2017 to 47% in 2020 and debit cards increased from 26 to 29%.
But the most significant change was in contactless payments, which accounted for almost 80% of the number of credit card purchases and about 70% of debit card purchases in 2020. The growth in contactless payments over the years (see Chart 2) shows the volume of payment shares by transaction value. The trends were similar in the value shares, with the exception of debit where shares have been stable over these years.
The Bank of Canada is continuing to monitor how COVID-19 affects cash demand and methods of payment with additional surveys this year, the first of which was in April.
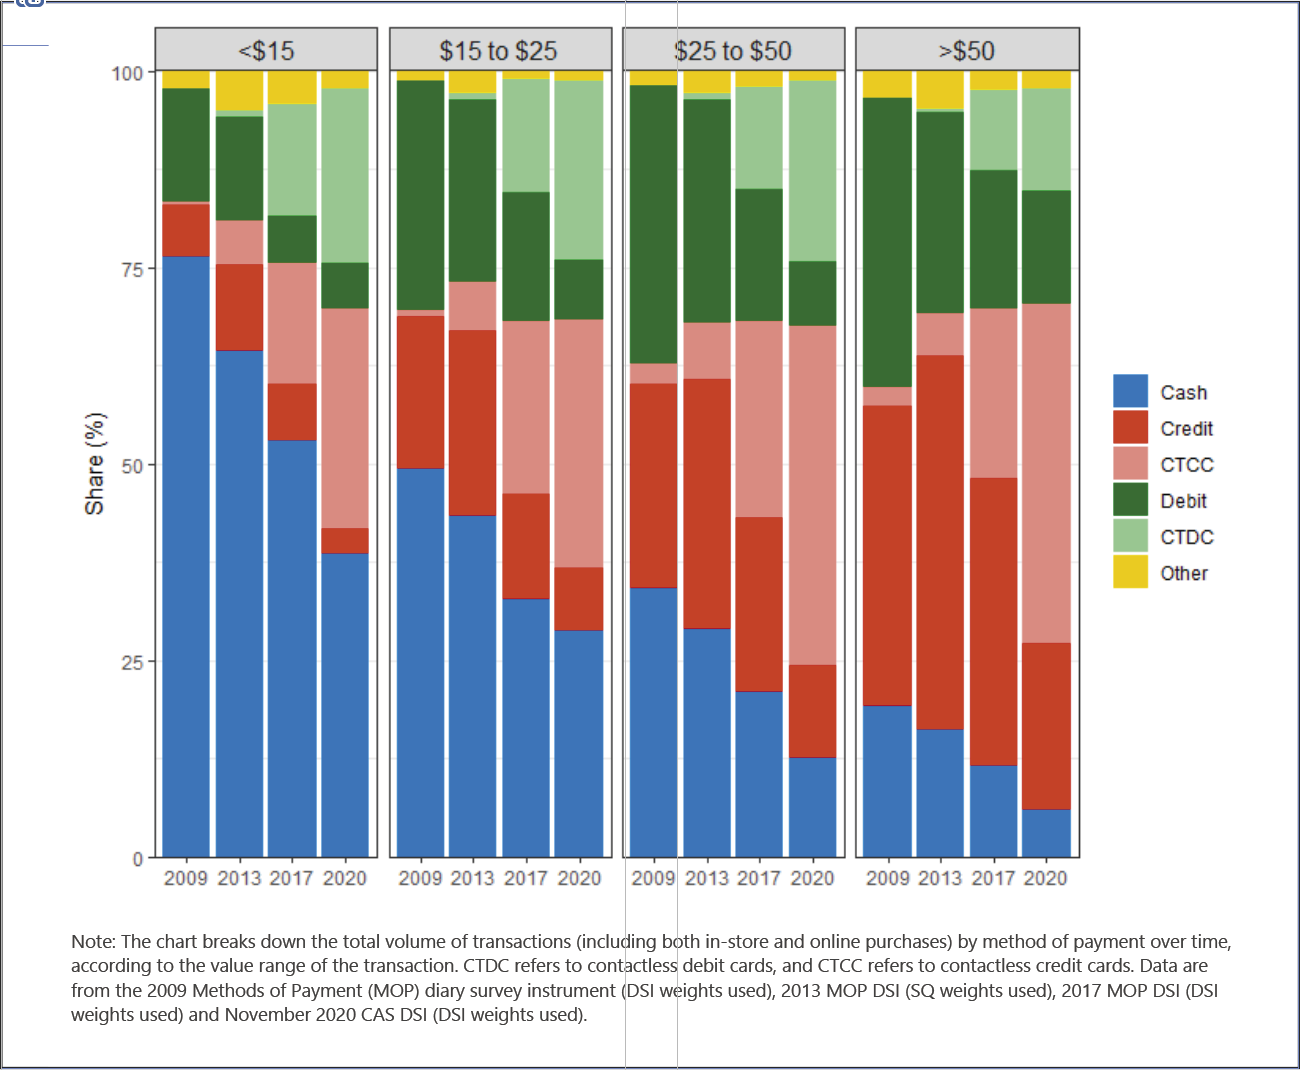 Chart 2: Payment shares over time: volume by transaction value.
1 - Published in July 2021 by the Currency Department, Bank of Canada. Hang Chen, Walter Engbert, Marie-Hélène Felt, Kim P. Huynh, Gradon Nicolls, Daneal O’Habib and Julia Zhu.