
In September 2020 Reconnaissance Consulting Group was asked to consider what would happen to cash at a future moment where the world economy and society had re-opened living with COVID.
Specifically, what would happen to cash used for transactions, not store of value.
The goal was to create a tool that was broadly right. Given that the past does not predict the future when a disruptive event happens, this required a different approach. This work was presented at the Bundesbank conference in June on ‘Cash in Times of Turmoil’.
The project was based on researching cash usage in Germany, the UK, the US, and Japan. It also looked at Thailand. The work progressed in stages:
Establish the link between access to cash and cash usage
Segment cash users into identifiable groups
Create and test a high-level methodology.
Like much research, the findings, once stated, appear obvious. But this work provided the evidence to support the conclusions which might otherwise be just assumptions.
In the end two slightly different tools were created but based on the same logic. The work did not progress to a full forecast but did supply a solution for the organisation that commissioned the work.
A data collection exercise explored the casual link between transactions and infrastructure. For the UK and Germany, the infrastructure is fully in place to allow the public to go less-cash today. The data does show card usage increasing and cash usage decreasing but that is not the story.
In the US bank account penetration is high and card usage prevalent. The US is different though, because the point of sale (POS) infrastructure is not wholly in place for contactless payments. Even cards with chips are relatively rare, only 50 million issued at the end of 2019. Mobile wallet payments started from a low base. This has implications for the speed of any move away from cash.
Japan has very high bank account and card penetration and widespread infrastructure.
Just as the infrastructure to pay without using cash is in place, the research also confirmed that the infrastructure to access and work with cash is in place in the markets studied. Whether people use cash or not is, therefore, largely a matter of choice.
We defined three segments in society – the wealthy, the majority and those who must or those who choose to use cash. The size of this last group determines the resilient ‘bottom’ that sustains a minimum level of cash transactions.
While the ‘wealthy’ have already moved away from using cash, the ‘majority’ like to use cash for low value transactions, when buying in person and for person-to-person (P2P) exchanges. Changes such as increases in contactless card spending limits, shops being willing to accept digital payment, even for very low value transactions, and lower merchant interchange fees appear to have been important in changing behaviour during the pandemic.
Given that the number of cash transactions is not effectively measured, the approach taken has been to look at what people buy and then whether they are paying in cash and how frequently they buy. How much they spend is of secondary importance.
Based on this, two models have been developed reflecting slightly different circumstances and using data sets from the UK and US. The key elements of both models are the:
Likelihood to pay in cash
Estimated number of transactions
Impact of COVID for three different levels of impact.
These have been applied to government data to generate a change in the number of transactions to compare with the pre-COVID number.
In the US the wealthy, the majority and those who must pay have been modelled separately and the totals then amalgamated to reflect their different spending patterns. This is because wealthy and ‘must pay’ segments are significantly bigger in the US than in the UK.
The research showed that there are real ‘national’ differences reflecting a mix of population, economics, culture, infrastructure and regulations. The use of any model needs to take these into account. Japan, for example, has a lower level of payment/purchasing internet interaction compared with the other countries studied.
Although coins are used to pay for low value items or as change in settlement, they are not included in this study. Results for coins can be extrapolated since data suggests each transaction made with a banknote requires settlement with 3-4 coins. This can be used to generate a figure for coins.
While the infrastructure for cash and for electronic payments is in place, the use of cash is a choice. Due to the widespread adoption of smart phones and QR codes, this is true in virtually all countries.
If people decide that they want to pay electronically, the switch away from cash can be big and fast.
The culture and circumstances of each country are unique. Germany, Japan, the UK and the US may all be advanced economies, but their payment behaviours are very different. One size does not fit all.
The size of the ‘Must & Choose’ segment (see below) is critical for the change in cash usage and any response to it.
Transactions drive the future of cash. Research needs to ensure that it captures both the number and the frequency of cash and electronic payments each week or month.
Although this work is simplistic and, no doubt, fails the robustness test of an economist, in disrupted times a simple tool that is roughly right gives everybody a chance to debate and understand what is happening and to start to plan the future.
The initial model took a simple, high-level approach. It listed a range of activities ranging from paying rent to buying a lunchtime sandwich and what percentage of the UK population paid for this in cash, this latter figure coming from research carried out by Enryo, the payments consultancy.
It then made an assumption about how frequently that purchase was made, for example once a month for rent and five times a week for a sandwich. That gave an estimated number of weekly transactions pre-COVID.
We then considered how COVID might affect whether they were made in cash.
Finally, scenarios for a high, medium and low-level impact on whether the payment was even made were used. The final output was how many cash transactions were made for each scenario compared with pre-COVID and the percentage change.
Government data is available for how much people spend on different items. This was used this to sense check that the original number of pre-COVID transactions was credible.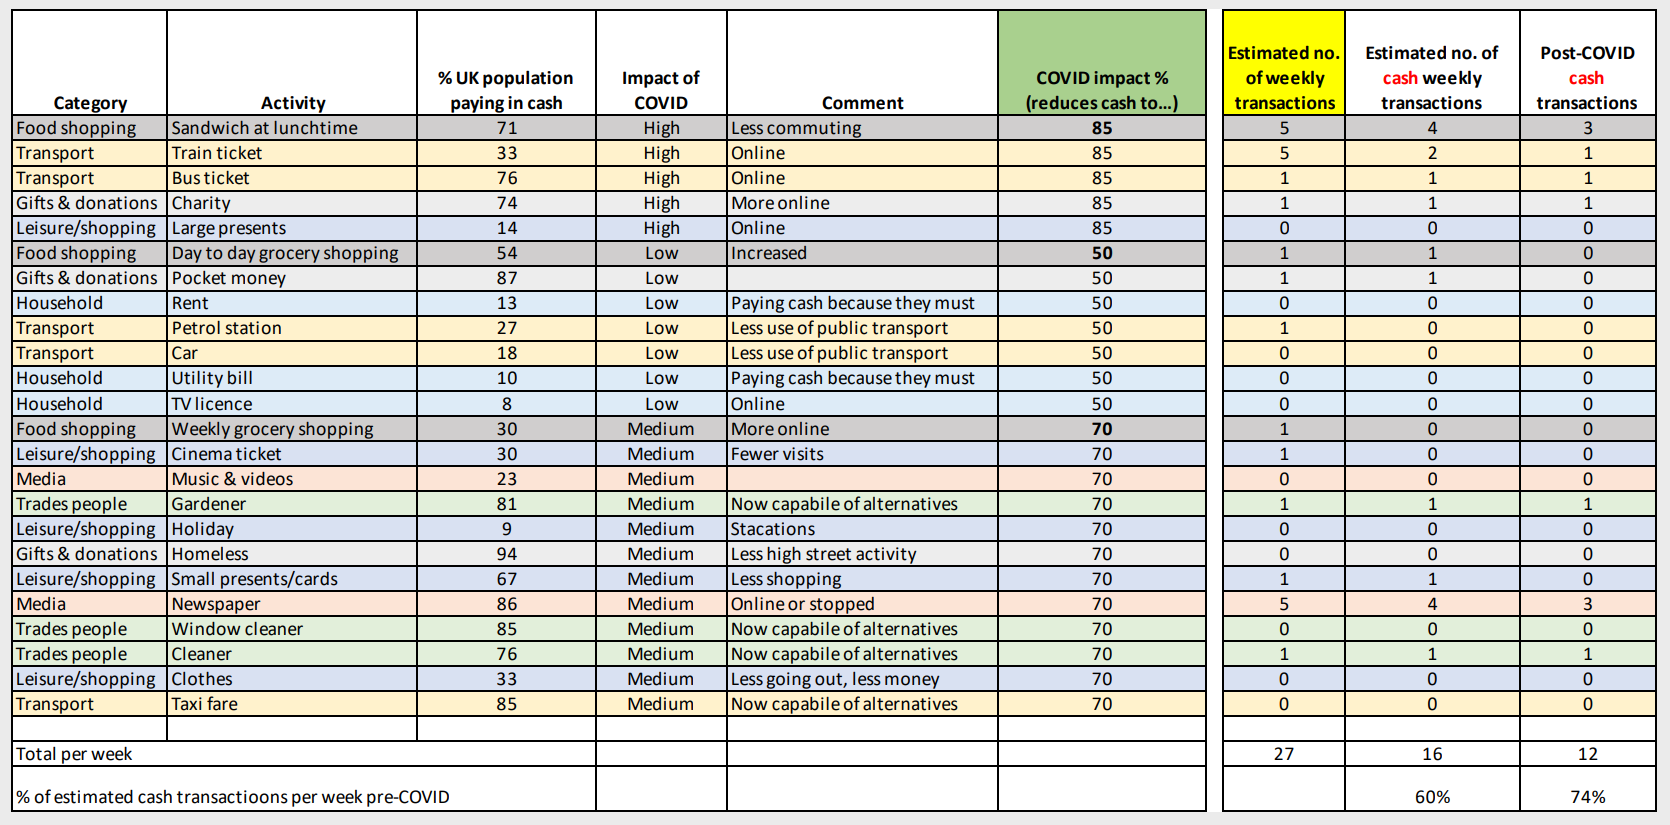
The columns highlighted in green and yellow are where estimates have been applied. In this scenario pre-COVID there had been 27 weekly transactions, of which 16 were in cash. The impact of COVID was to reduce cash transactions to 12, 74% of the pre-COVID figure.
This approach gives a quick and high-level result. It depends on good data about the percentage of the population paying in cash for a range of items. We started work using the Office of National Statistic household expenditure data to give more certain input data but have not concluded that work.
One drawback is that it treats all consumer behaviour as the same.
In the US we used the Federal Reserve of Atlanta’s payment diaries as our input data and used government data on income and the banked/unbanked/underbanked to populate the three segments. We then modelled the three segments and multiplied out the results by segment size to create a national figure for the US.
For each of the 16 categories of purchase in the payment diary we applied some assumptions, for example: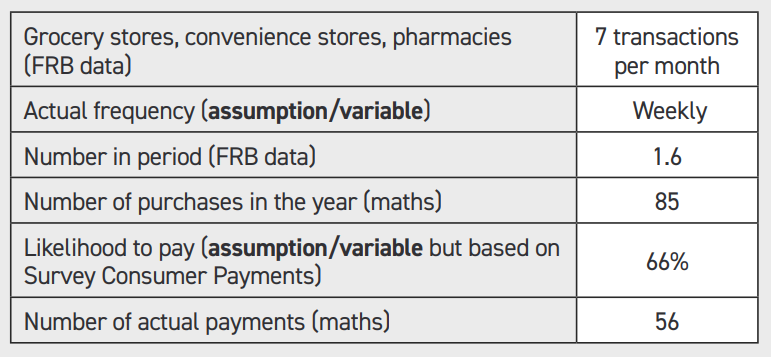
The Payment diary showed 38.7 payments per month. In our model, each segment had a different total, for example the ‘Must & Choose’ segment made more purchases each month (46) and more in cash (30) compared with the ‘Majority’ segment, 35 purchases with nine in cash.
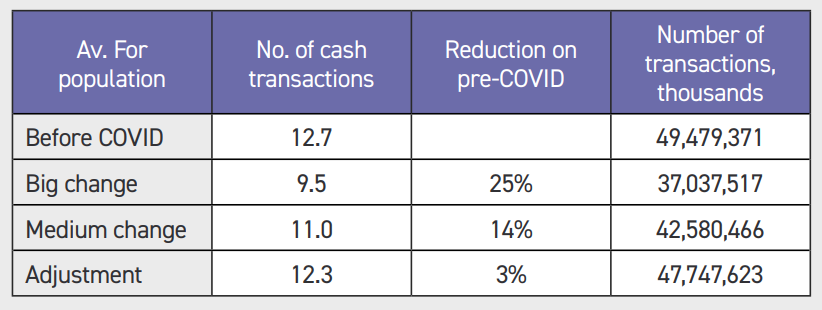
In this model the COVID impact assumptions were made across all items rather than item by item. In September 2020, rather arbitrarily but having spent considerable time examining what was happening, we tested the model by saying COVID would, post-pandemic, have reduced cash transactions by: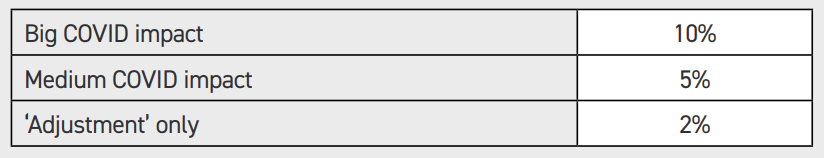
The logic for such relatively small adjustments is that in the US the ‘Must & Choose’ segment has little discretionary spend and prefers cash; it is 21% of the population and it is already the major cash user. The logic for such relatively small adjustments is that in the US the ‘Must & Choose’ segment has little discretionary spend and prefers cash; it is 21% of the population and it is already the major cash user.